Stepping through OT/J code
The byte code into which OT/J programs are translated has some significant differences
to the original source code. In order to hide some generated code and to provide
convenient stepping even through declarative method bindings, the debug view has
been enhanced for OT/J.
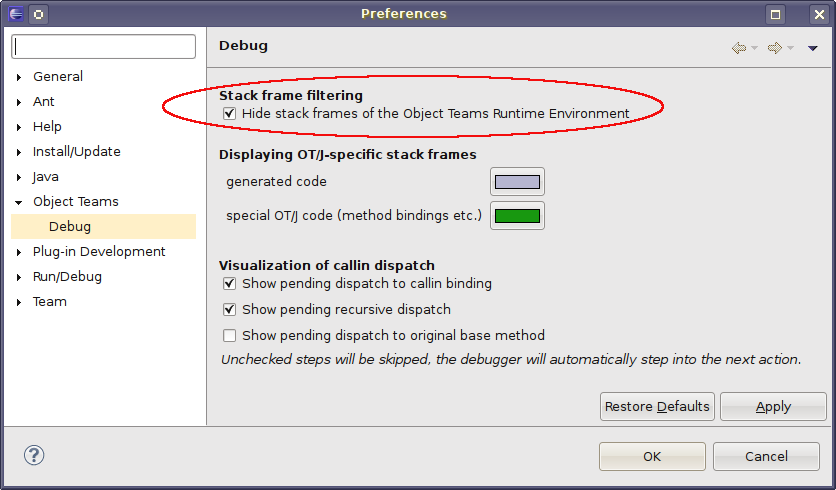
Filtering infrastructure code
By default the debugger is configured to filter certain packages in order to hide
the Object Teams Runtime Environment (OTRE) and its libraries. This means that
the debugger will not show stack frames corresponding to the OTRE while stepping
through code. This filtering can be disabled on the preference page at Object Teams — Debug
Callin bindings
In order to realize the runtime dispatch for callin bindings, additional dispatch
code is generated and woven into the byte code of bound base classes.
Most of this dispatch code is hidden by the debugger,
but an abstract view of it is presented
in order to support different paths of stepping into/through/over callin bindings.
Typical stepping paths will be explained using the example OTSample-Flightbonus
which can be installed using the wizard at
After the example has been installed and configured for running with the team
GUIConnector activated (see the example's documentation),
assume a new passenger has been registered and subscribed for the bonus system.
Also assume a  line breakpoint has been set somewhere in method
 Segment#book().
When the lastly added passenger books a flight, this line breakpoint is triggered.
From here on stepping proceeds as follows:
- Step (F6) out of method
book() until the debugger jumps to the top of the current method book(Passenger):
|
| Hitting callin dispatch: | 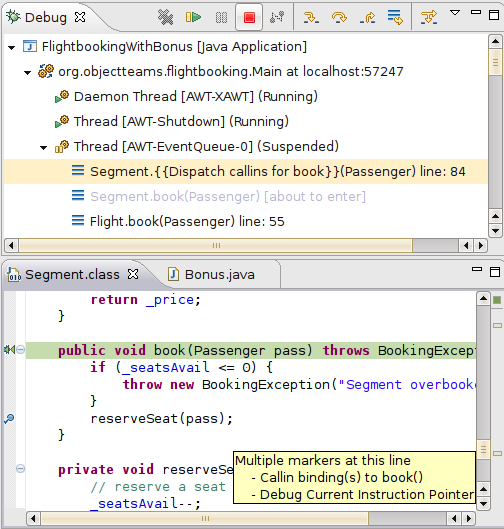
|
At this point the debug view signals that some dispatch is pending for method book. A few words on what you see in this picture:
- The current stack frame says
{{Dispatch callins for book}}, at what time the list of currently active teams is investigated.
This stack frame is drawn in a pale color (unless highlighted) to visualize that this is generated code.
If multiple teams are active that have interest in this method, the generated dispatch code will be invoked recursively,
causing multiple stack frames to show up in the debug view.
- Below you see another pale stack frame saying
[about to enter]. This stack frame contains no interesting code
and can safely be ignored.
- The highlighted line in the editor has a callin marker (
 ) associated, hinting at the callin bindings that are about to fire
(see also the hover of this line's annotations). ) associated, hinting at the callin bindings that are about to fire
(see also the hover of this line's annotations).
You now have two options:
- If at this point F7 is pressed the debugger skips over all dispatching and
proceeds in the base program.
- By pressing F5 you enter the current callin binding:
|
| Entering a callin binding: | 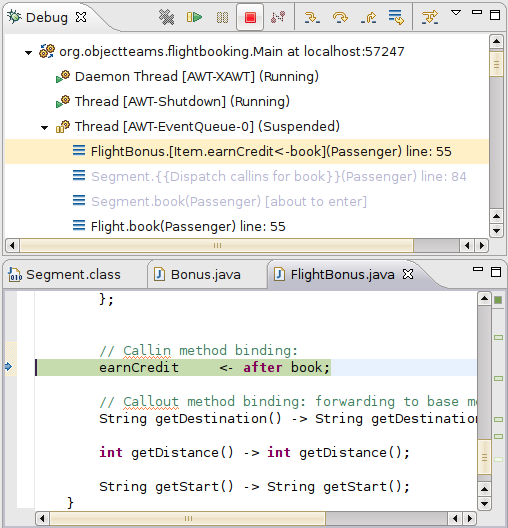
|
Now the debug view displays a new
faked stack frame labeled with the callin binding: [Item.earnCredit<-book].
- The next F5 takes you to the lifting translation (this step is missing if dispatching to a static role method).
|
| Lifting: | 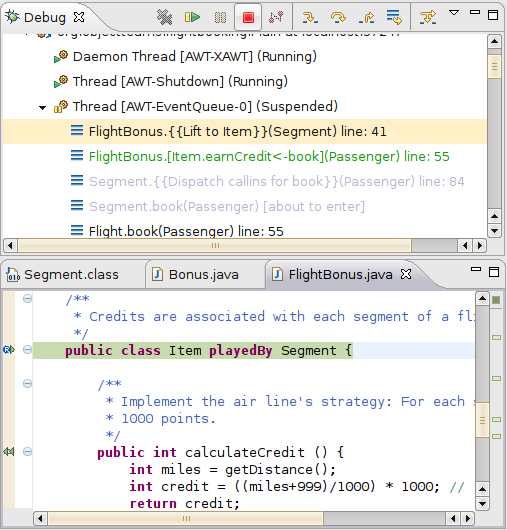
|
The above screenshot shows the debugger while a lifting translation is pending.
The Debug view signals this by the faked stack frame labeled {{Lift to Item}}.
Since no real source code exists for the lifting method the editor highlights the
playedBy declaration from the class header.
This declaration tells you that the current lifting operation will translate a Segment
into an Item.
You'll normally want to just leave the lifting method:
- F7 (or F6) takes you out off the lifting method and back to the callin binding.
- Once more pressing F5 finally steps into the bound role method.
If a guard predicate were present, the guard would be entered here, before finally proceeding to the role method.
Of course, entering a guard predicate can be skipped by pressing F6 at that point.
|
| Entering the role method: | 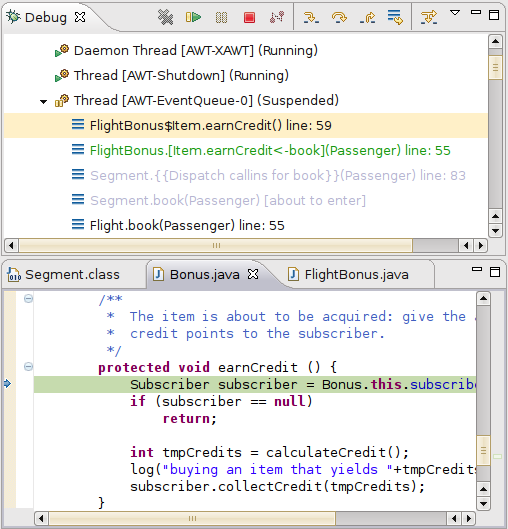
|
At this point you're back in a normal Java method (role method), just the pale and green stack frames tell you
that you haven't entered this method via a normal method call but via callin dispatch.
If we would be looking at a callin method with a base call, stepping into that base call
would also trigger some dispatch before either stepping into the original base method
or proceeding with dispatching to other pending callin bindings. |
Stack frame coloring
In the above screenshots you see some stack frames printed in colors.
While the exact colors to use can be configured in the preference page shown above,
the meaning of colors is as follows:
- light purple
- Dispatch code with no direct correspondence in the source code.
- green
- Callin binding declarations and base-calls – each green stack frame signals a crossing of a team boundary.
Configuring the callin stepping behavior
In the above scenario the debugger stops at several locations where the current stack frame says: {{Dispatching callins for book}}.
All these locations can be configured such that the debugger will automatically step into the next action.
Looking again at the preference page Object Teams — Debug:
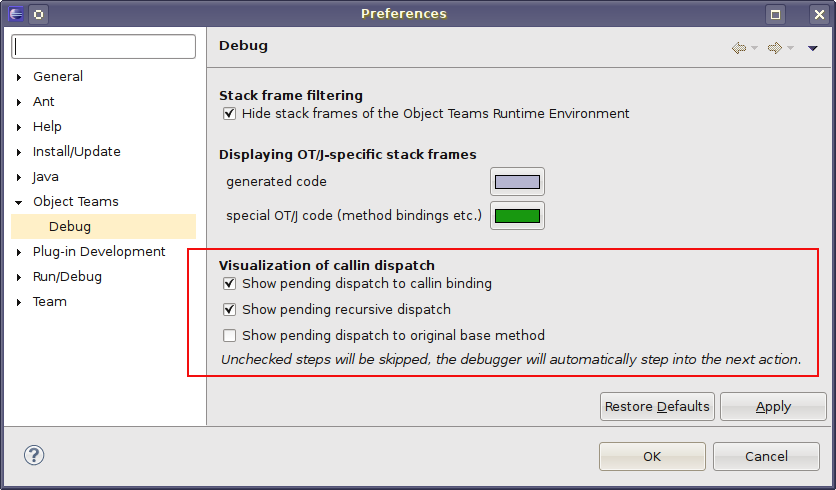
The highlighted section of this preference page shows three options, each of which represents a particular kind of dispatching situation:
- Pending dispatch to the callin binding:
- The next step-into will take you to a callin method binding, because an active team instance claims interest in the control flow.
At this stage the appropriate team instance has already been selected, however, guard predicates may still cancel dispatch to the role method.
- Pending recursive dispatch:
- The next step-into will take you into the next recursion of the current dispatch method.
This is relevant mostly if you want to analyze how multiple teams that affect the same base method are scheduled.
When enabling the display of OT/J internal variables you may inspect the internal iterator of team instances (an array of teams plus an index into the array).
- Pending call to the original base method
- This signifies the final iteration of the dispatch code at what point the original method will be entered by the next step-into.
This stage can, e.g., be reached when a
callin method has issued a base-call.
Instead of directly entering the base method, the dispatch code needs to take over,
because more team instances might be waiting to receive the control.
By default all of these pending actions are visualized as mentioned.
Disabling any of the check boxes causes the debugger to skip the corresponding step and automatically step into the pending method.
In this mode debugging may be faster, because fewer steps are needed, but the execution may jump to unpredicted locations.
If the scheduling of perhaps multiple active teams needs investigation, the more verbose modes might be of more help.